DriveTTO:Understanding Search and Selection
in Test-Time Trajectory Optimization
More from a frozen driving planner.
Search around an existing trajectory. Compare complete candidates.
Improve the plan at inference time, with the planner held fixed.
95.5PDMS ↑
92.3EPDMS ↑
57.1EPDMS ↑
54.5RC ↑
40.1HD-Score ↑
Paper benchmark results. Each benchmark uses its reported configuration; protocol details accompany the tables.
01 / OVERVIEW
A better plan.
The same planner.
A frozen driving planner still leaves room to improve its trajectory at inference time.
DriveTTO searches around the planner’s output, proposing complete trajectories through endpoint search and temporal fusion. It scores the candidates alongside a preserved reference and returns the selected trajectory, without updating the planner’s parameters.
We examine this approach in NAVSIM evaluation and HUGSIM closed-loop driving. The results distinguish the full strategy, search variants, and benchmark-specific configurations, together with their runtime and transfer behavior.
02 / METHOD
Search the trajectory.
Keep the model fixed.
Construct complete alternatives around a retained plan, then compare candidates and the reference using frozen scorers.
ANIMATED EXPLAINER
From endpoint search to precise motion.
A continuous 2-minute 48-second illustration of endpoint feedback and two-planner refinement.
Watch complete-path evaluations reveal a promising endpoint region, then follow the two planners through local refinement and matched-time fusion. Close-ups show how small position changes affect vehicle clearance. Geometry and utility are schematic.
Download animation ↗ Explore interactive animation ↗- 01
Preserve the reference
Start from the frozen planner’s output and retain the reference trajectory in the candidate set.
- 02
Propose complete trajectories
Explore endpoint variations and temporal fusion to construct candidate trajectories around the existing plan.
- 03
Compare and return
Evaluate complete candidates with the configured scoring rule and return the selected trajectory for execution.
03 / CLOSED-LOOP DRIVING
On the road,
scene by scene.
Inspect selected HUGSIM rollouts with their scene conditions and evaluation metrics.
Select a rollout below.
Selected examples illustrate individual rollouts. Aggregate performance is reported in the benchmark tables below.
04 / PLANNING VISUALIZATIONS
The plan, in context.
Illustrative NAVSIM examples, selected at 100 PDMS. Switch between the front and bird’s-eye views, or open a figure to inspect the full image.
Plans in motion
Recorded front-camera frames and calibrated plan projections, paired with a bird’s-eye view. These open-loop animations follow the saved Full / seed 0 plan; camera motion and other agents come from the recorded scene.
05 / EXPERIMENTS
Results, with context.
Compare the full strategy, search variants, and planner transfer under their reported protocols.
HUGSIM · Closed-loop comparison
Route Completion (RC) and HD-Score. Higher is better.
Easy / Medium / Hard / Extreme + overall average
RC: Route Completion · HD-Score: driving quality. Avg. is computed across all 345 scenarios; it is not the unweighted mean of the four difficulty columns.
Paper-reported comparison rows follow the Gigapixel and DriveZero evaluation records. DriveTTO uses observed commands and a weighted-control schedule; its averages cover all 345 scenarios. DriveZero-Scale has the highest HD-Score in this table.
Reproduced baselines and input configurations
345 observed development scenes, simulation seed 2, 50 ms wall-clock iLQR. Observed-command v4 changes command inputs relative to fixed-straight. The selected videos are individual high-scoring examples, not the aggregate distribution.
Transfer across base planners
Native outputs, ToAD, and DriveTTO-S with the same native anchor and top-64 bank.
NAVTEST PDMS ↑
NAVHARD EPDMS ↑
DriveTTO-S is the single-scorer endpoint_post transfer branch; ToAD uses K = 10 on NAVTEST and K = 5 on NAVHARD. Native denotes each base planner’s original output. These settings are separate from the full-strategy benchmark results. In the isolated search timing study, DriveTTO-S takes 153.9–185.2 ms versus 40.3–48.8 ms for ToAD (median ratio ≈3.8).
Inspect the numbers behind the page.
Download results CSV06 / RESOURCES
Explore DriveTTO.
Code, reported results, and selected visual evidence in one place.
Project code
Explore the DriveTTO repository.
Benchmark results
Download the reported comparison tables.
Selected media
Scene identifiers, metrics, and media selection.
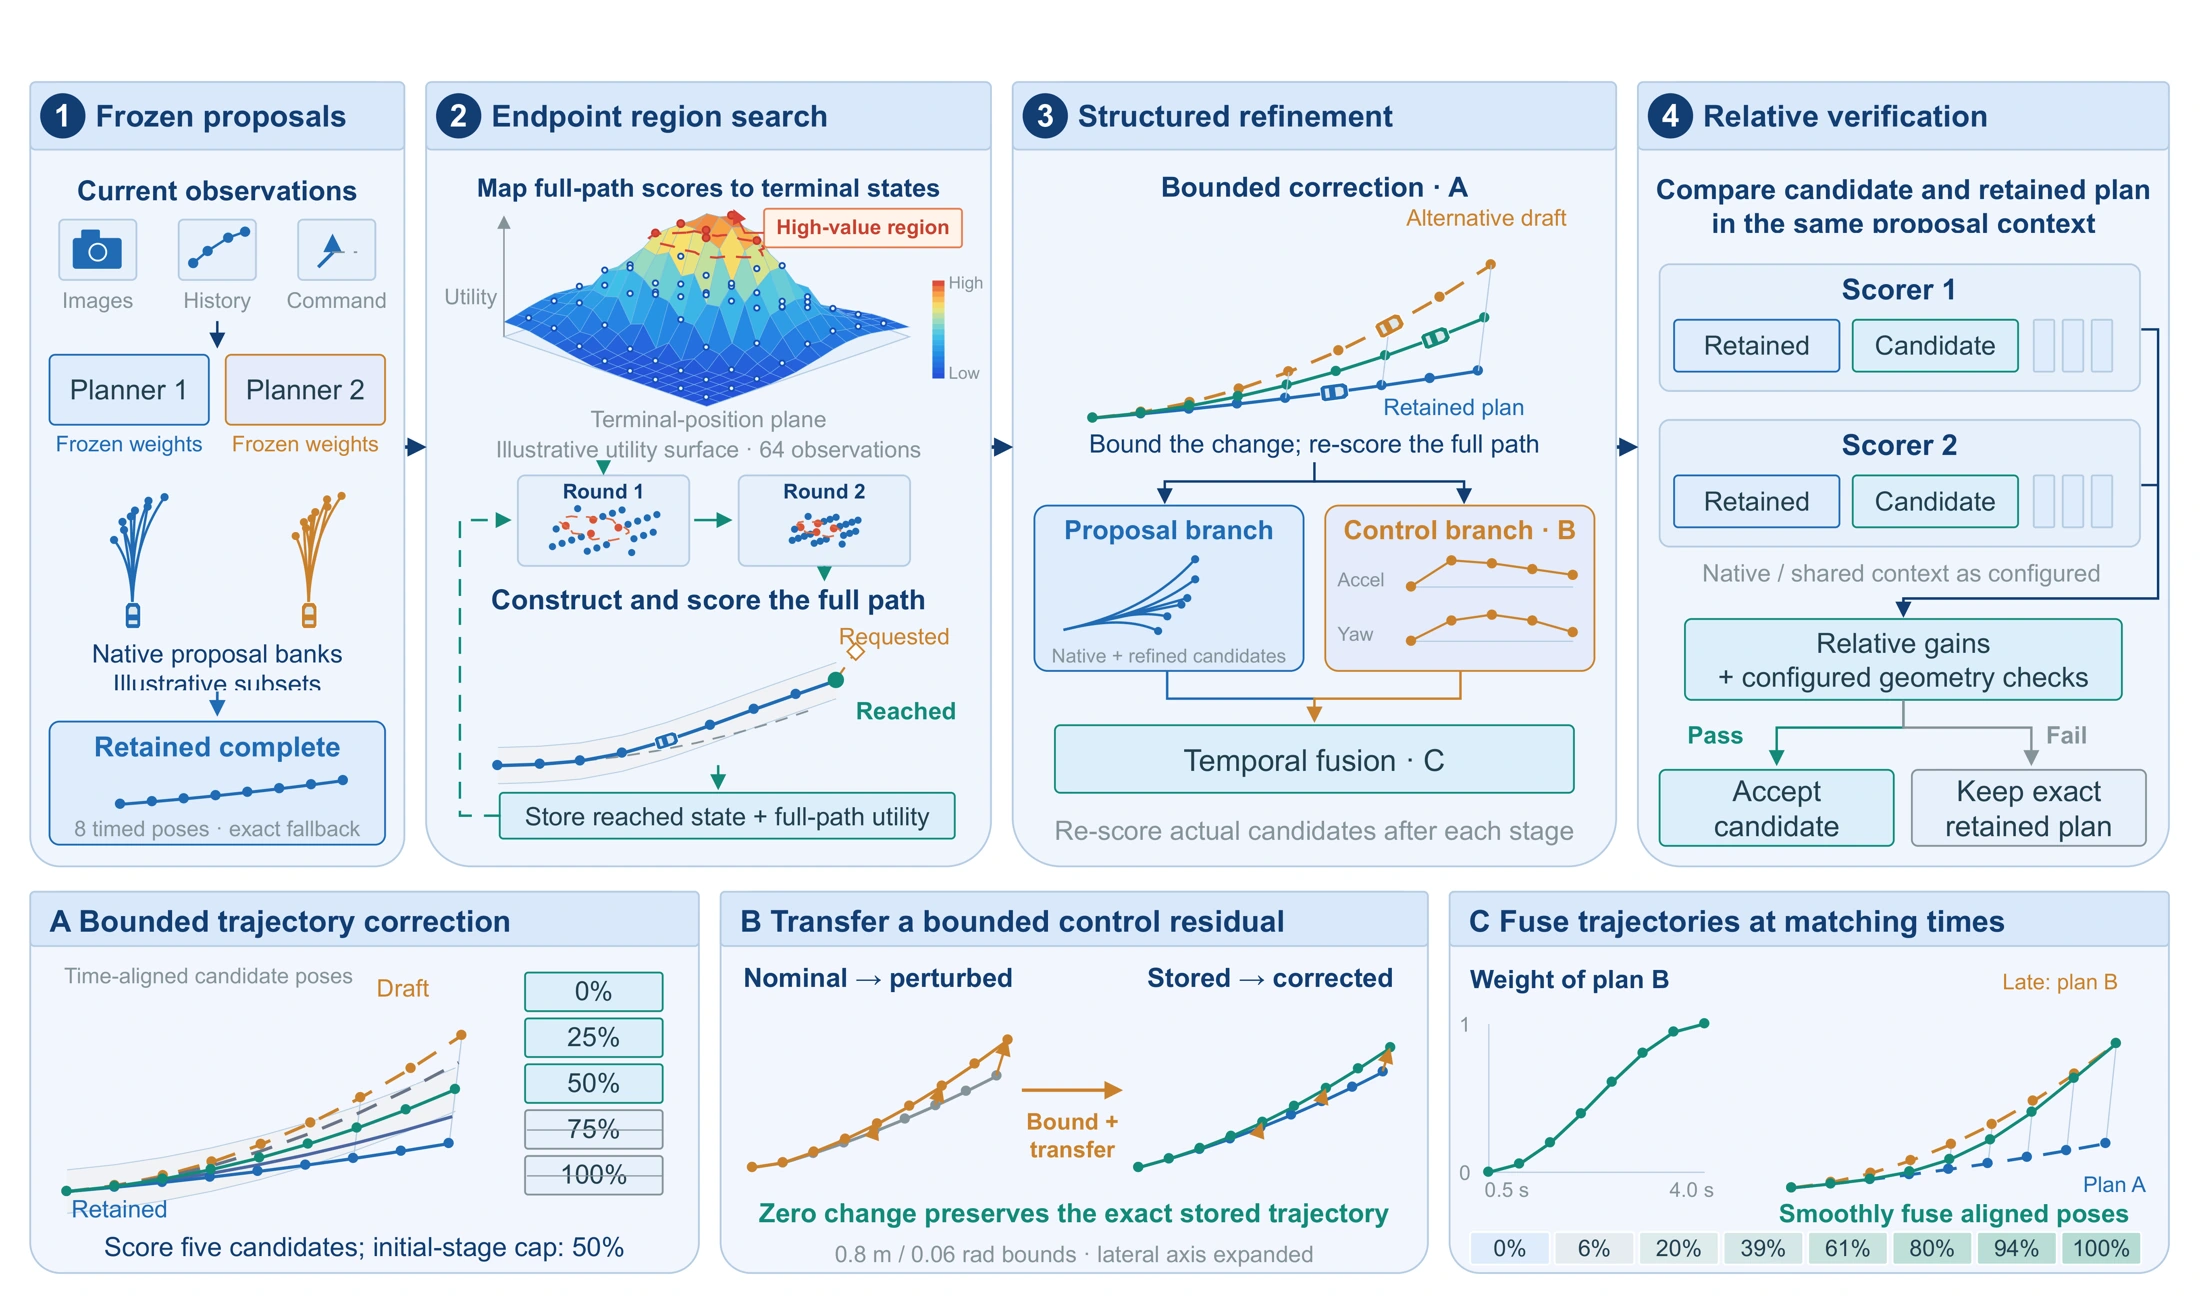
Method overview
The complete DriveTTO framework figure.
Paper coming soon. A paper link and citation will be added when available.